
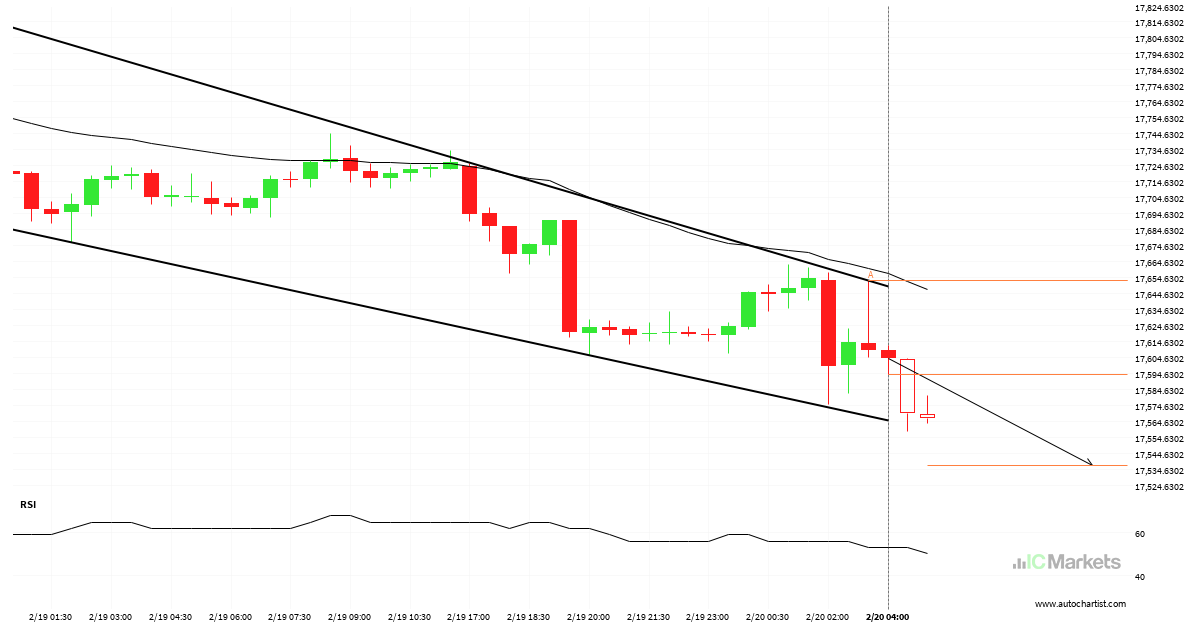
US Tech 100 Index – Continuation Padrão gráfico – Canal descendente
Um Canal descendente emergente foi detectado em US Tech 100 Index no gráfico 30 Minutos. Há um possível movimento em direção ao 17537.1365 nas próximas velas. Uma vez atingindo resistance, pode continuar sua tendência bearish ou reverter para os níveis atuais de preço.
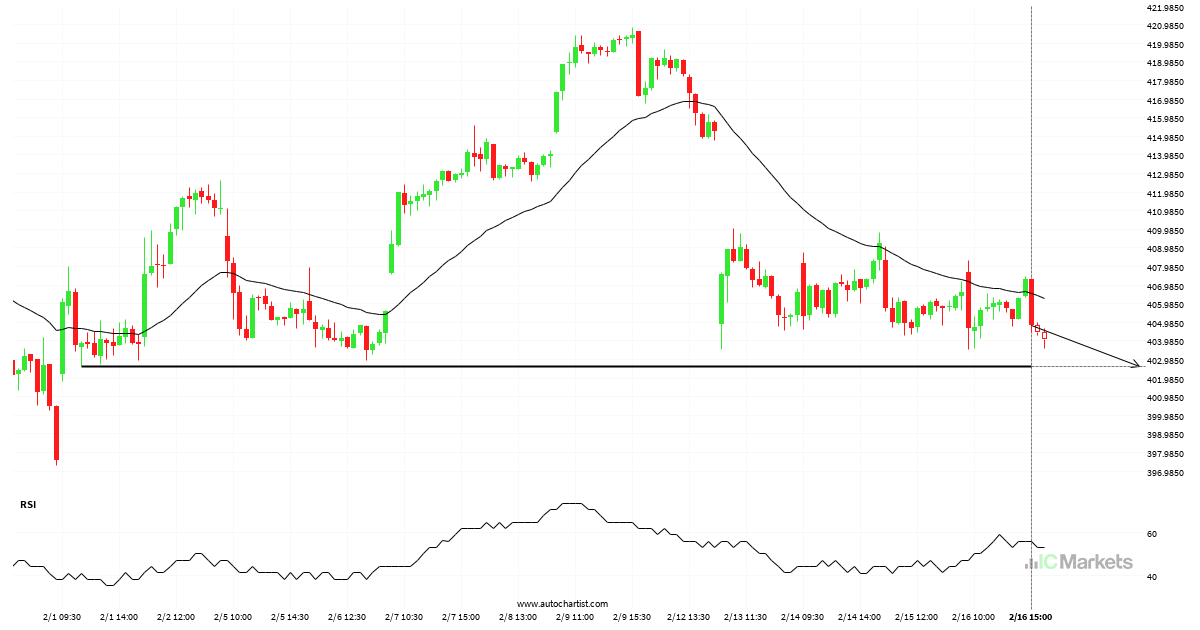
Microsoft Corporation Nível visado: 402.6000
Aproximando-Apoiar nível de 402.6000 identificado em 16-fev-2024 15:00 EST
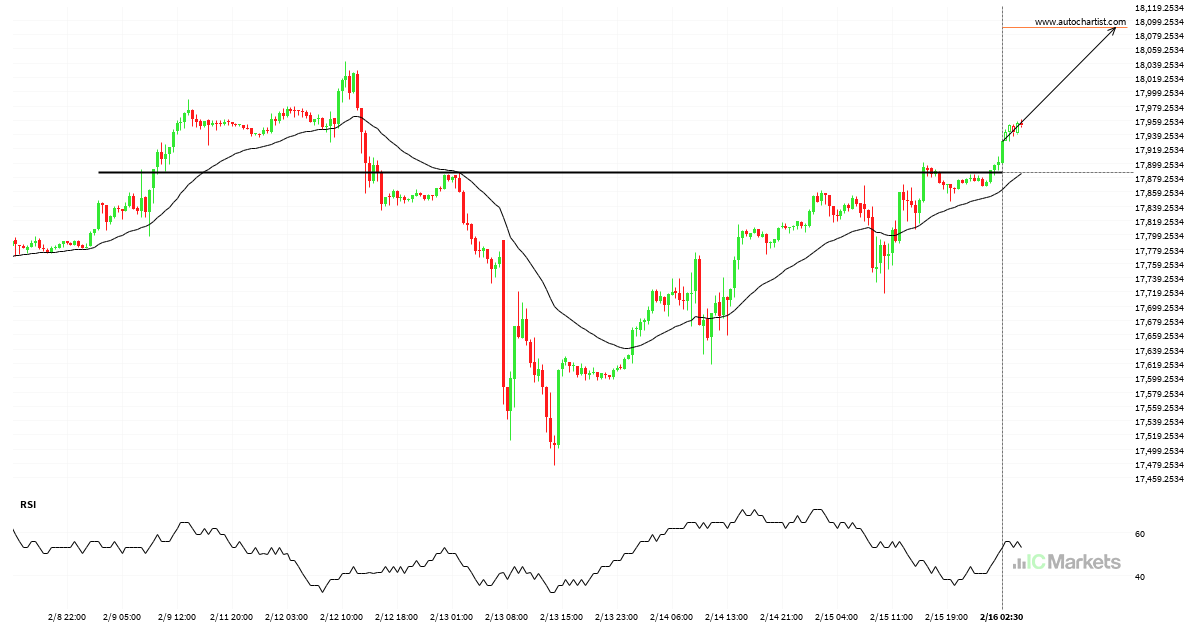
US Tech 100 Index Nível visado: 18088.6699
Rompeu Resistência nível de 17886.8008 em 16-fev-2024 02:30 EST
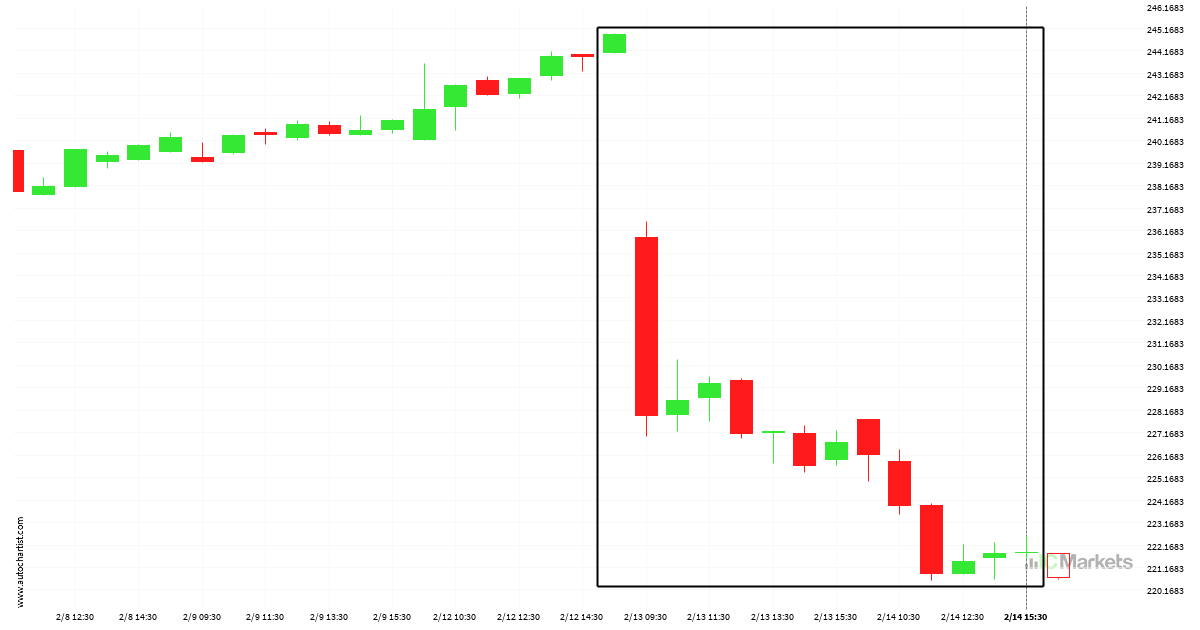
Biogen Idec Inc movendo-se downward, não perca.
Biogen Idec Inc dropped acentuadamente por 2 dias – o que é um movimento excessivamente grande para este instrumento; excedendo 98% das movimentações de preço passadas. Mesmo que este movimento seja um sinal de uma nova tendência em Biogen Idec Inc, há uma chance de que testemunhemos uma correção, por mais breve que seja.
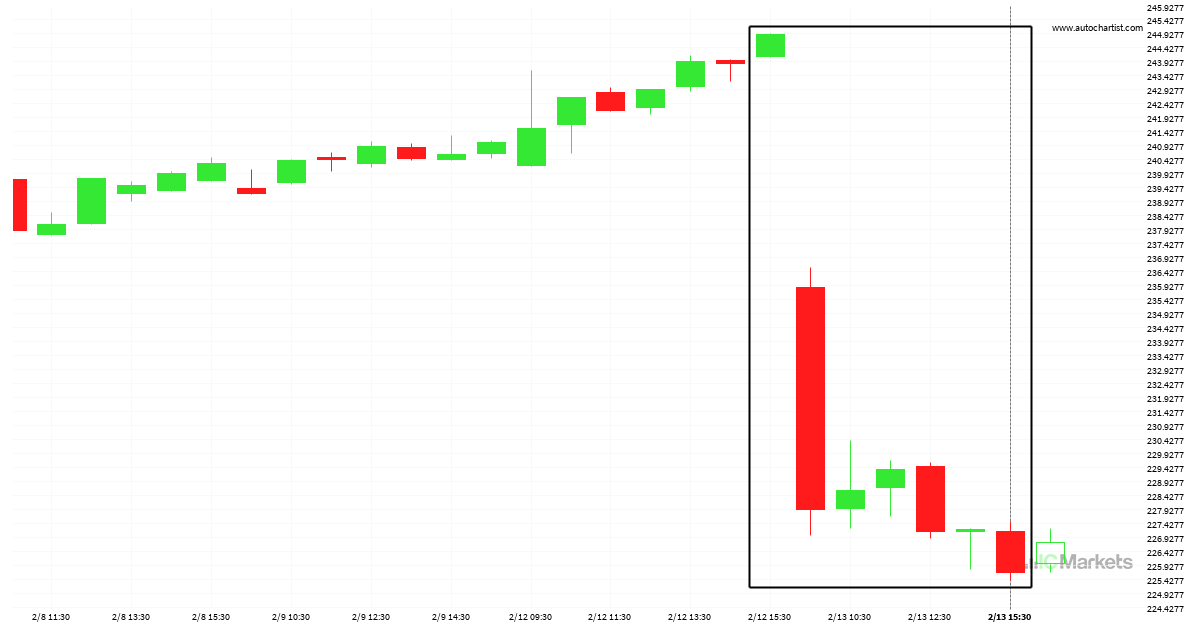
Biogen Idec Inc movendo-se downward, não perca.
Biogen Idec Inc dropped acentuadamente por dia – o que é um movimento excessivamente grande para este instrumento; excedendo 98% das movimentações de preço passadas. Mesmo que este movimento seja um sinal de uma nova tendência em Biogen Idec Inc, há uma chance de que testemunhemos uma correção, por mais breve que seja.
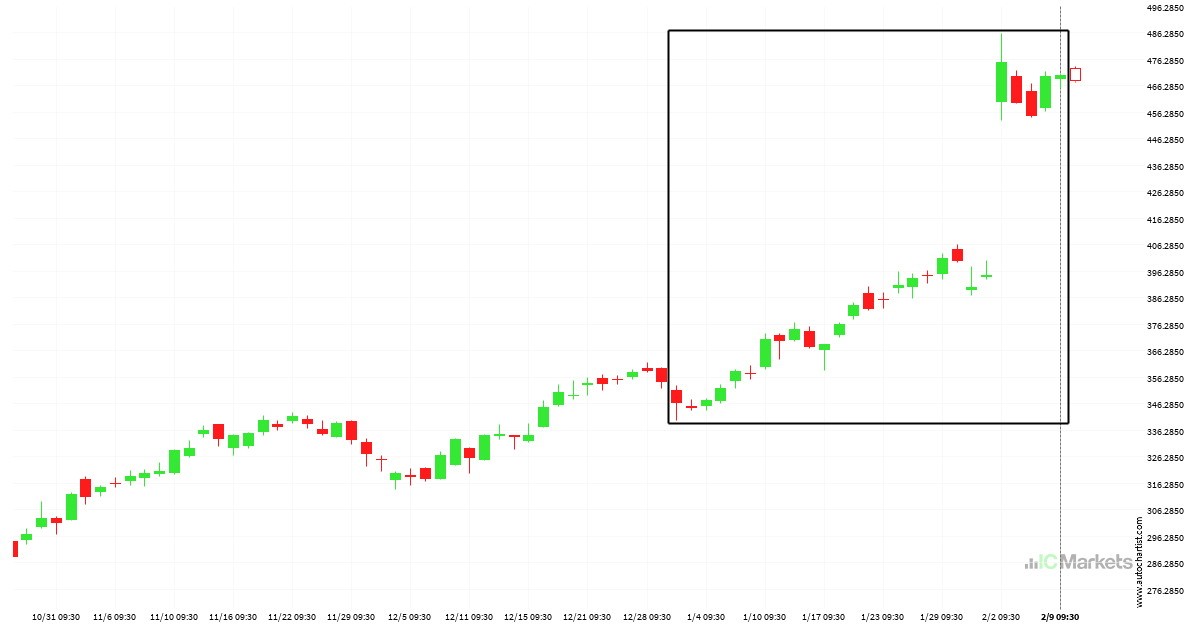
Meta Platforms, Inc. – Class A Common Stock movendo-se upward, não perca.
Meta Platforms, Inc. – Class A Common Stock rose acentuadamente por 38 dias – o que é um movimento excessivamente grande para este instrumento; excedendo 98% das movimentações de preço passadas. Mesmo que este movimento seja um sinal de uma nova tendência em Meta Platforms, Inc. – Class A Common Stock, há uma chance de […]

US Tech 100 Index – Continuation Padrão gráfico – Cunha ascendente
Um Cunha ascendente emergente foi detectado em US Tech 100 Index no gráfico 30 Minutos. Há um possível movimento em direção ao 17879.0679 nas próximas velas. Uma vez atingindo support, pode continuar sua tendência bullish ou reverter para os níveis atuais de preço.
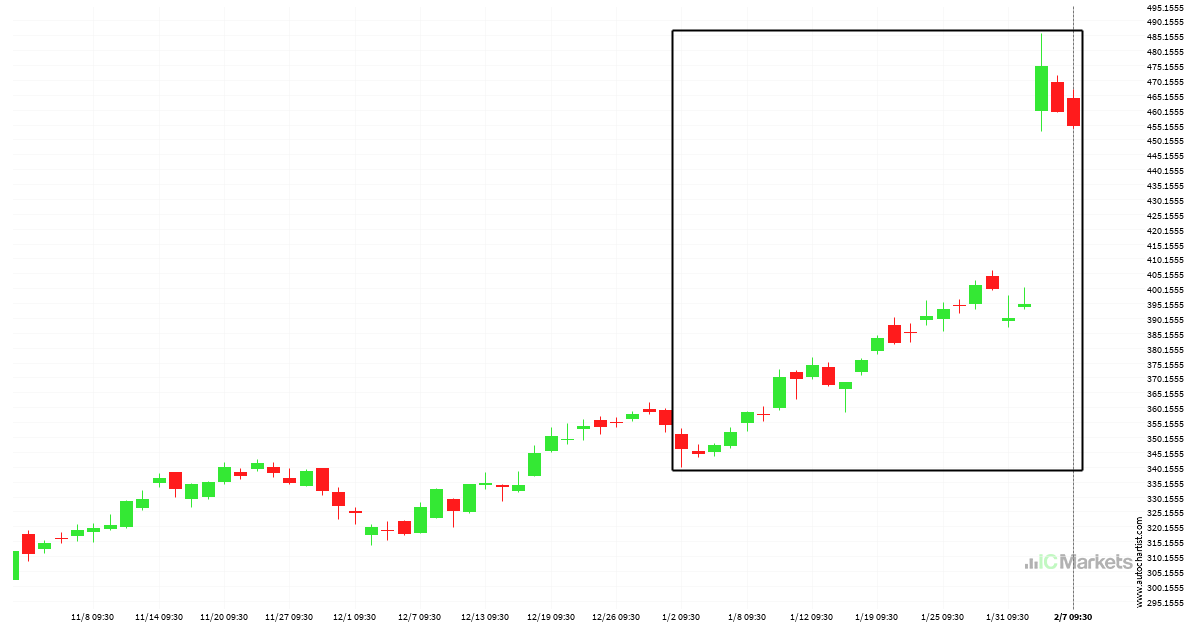
Meta Platforms, Inc. – Class A Common Stock movendo-se upward, não perca.
Meta Platforms, Inc. – Class A Common Stock rose acentuadamente por 36 dias – o que é um movimento excessivamente grande para este instrumento; excedendo 98% das movimentações de preço passadas. Mesmo que este movimento seja um sinal de uma nova tendência em Meta Platforms, Inc. – Class A Common Stock, há uma chance de […]
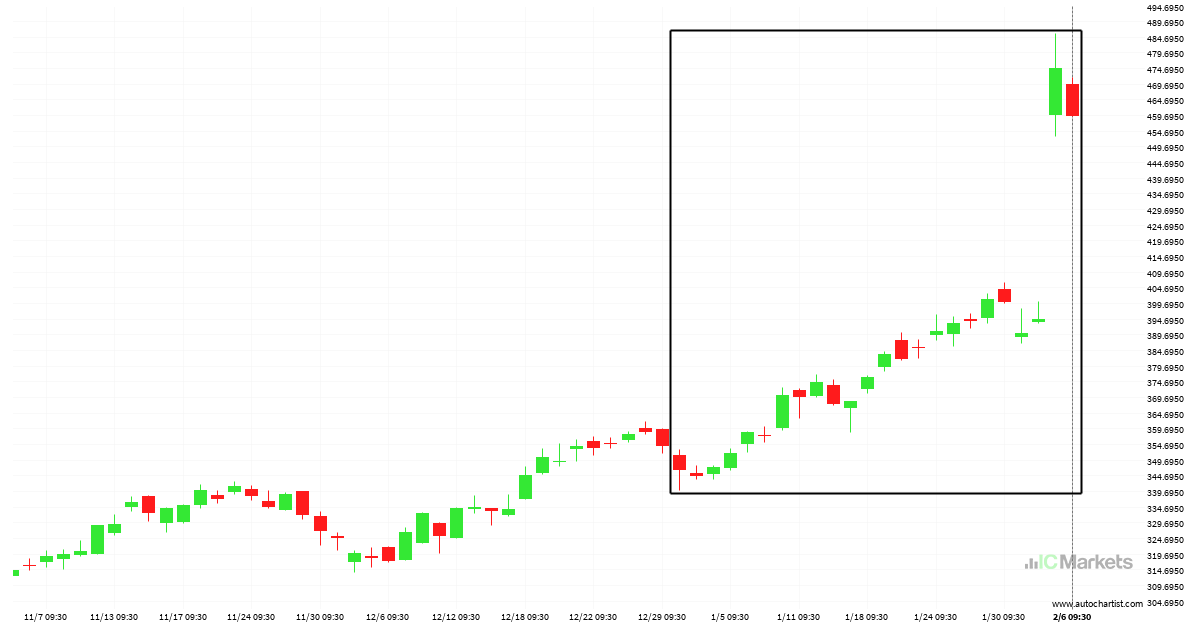
Meta Platforms, Inc. – Class A Common Stock movendo-se upward, não perca.
Meta Platforms, Inc. – Class A Common Stock rose acentuadamente por 35 dias – o que é um movimento excessivamente grande para este instrumento; excedendo 98% das movimentações de preço passadas. Mesmo que este movimento seja um sinal de uma nova tendência em Meta Platforms, Inc. – Class A Common Stock, há uma chance de […]
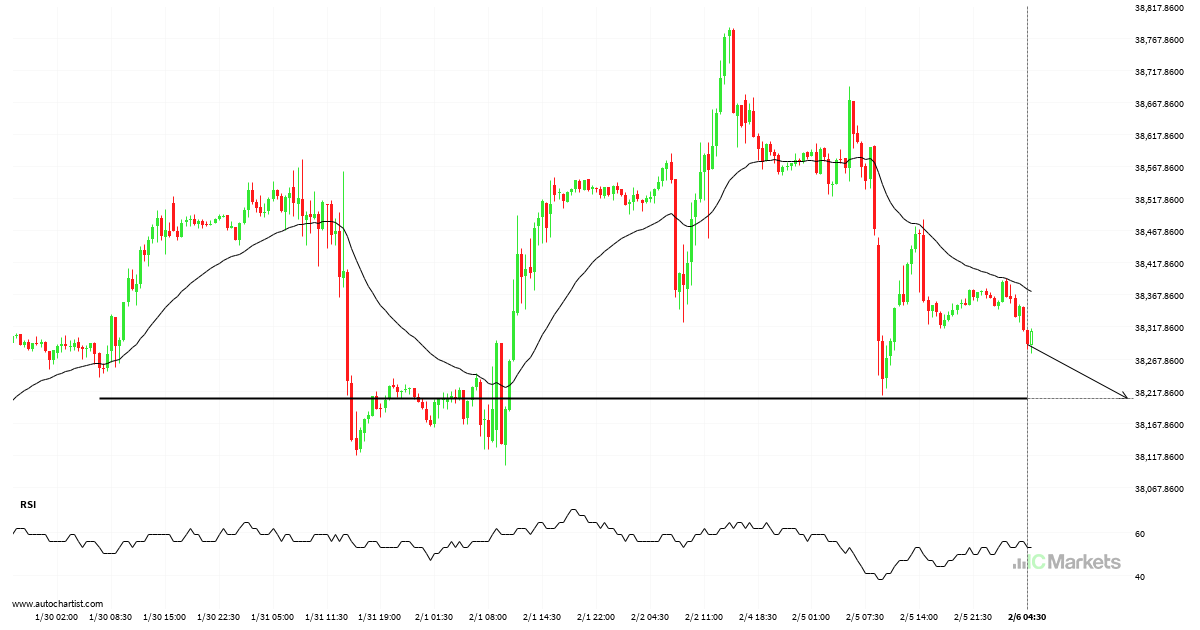
US Wall Street 30 Index Nível visado: 38206.8984
Aproximando-Apoiar nível de 38206.8984 identificado em 06-fev-2024 04:30 EST